
WHAT DO THE MOST PROFITABLE PASTURE BASED SYSTEMS LOOK LIKE?
Presentation to South African Large Herds Conference - February 2005
By David Beca
SUMMARY
The most profitable pasture based farming systems generally exhibit five key qualities. These include:
1. Pasture harvest levels that are 15%-25% above average
2. Milk production per hectare 15%-30% above average made up from:
2.1. Stocking rate (cows/hectare) 10%-20% above average
2.2. Milk production per cow 5%-15% above average
3. Supplementary feed cost 5%-20% below average made up from:
3.1. Forage costs 5%-25% below average often as a result of a higher proportion of home grown rather than purchased forage
3.2. Concentrate costs 5%-15% below average often as a result of astute purchasing policies and lower use of protein/minerals/additives
4. Labour efficiency (measured as cows milked per full time staff equivalent) 10%-30% above average
5. Base cost structure per cow 5%-15% below average
The attached appendix of benchmark figures from Australia and New Zealand highlight the changes in performance between average or near average farms and the more profitable dairy farms.
Although we can describe how the most profitable pasture based systems vary from “the norm”, it is not possible to describe what this system “looks like”. This is due to the fact that the numerous curvilinear relationships governing animal production and pasture production mean that there are numerous variations to pasture based farming systems that can express the same result in terms of profit.
This is further complicated by the influence the key operator of a pasture based dairy business exerts on the final level of profitability. This can mean that two operators on near identical farms using the same resources in both livestock and feed will consistently produce substantially different results.
Finally this is complicated by the fact that the most profitable pasture based farming system will look different between countries and between districts within countries, as well as within districts in countries, depending on milk price, potential pasture growth, supplementary feed price and base cost structure. This will mean that the optimal position on Graph 1 for milk production, profit and risk, as well as the “tipping point” on the profit and risk graph will vary for every dairy business.
PASTURE HARVEST – 15%-25% ABOVE AVERAGE
By harvesting more pasture this usually has the effect of reducing the cost of pasture. This reduces the average cost of feed and therefore the average cost of production. In addition this economically provides an opportunity to both increase stocking rate and/or increase the level of milk production per cow to increase milk produced per hectare.
The most profitable farms have addressed any soil fertility issues and strategically use nitrogen as critical components of maximising pasture harvest. Their pasture management is exact, in particular their daily allocation of pasture. This involves ensuring pre-grazing pasture cover and post-grazing pasture residuals are maintained at appropriate level, which requires a planned gazing intensity and at times some mechanical harvesting of pasture when either quantity or quality of pasture falls outside certain parameters.
GRAPH 1: Relationship between Milk Production, Profit and Risk
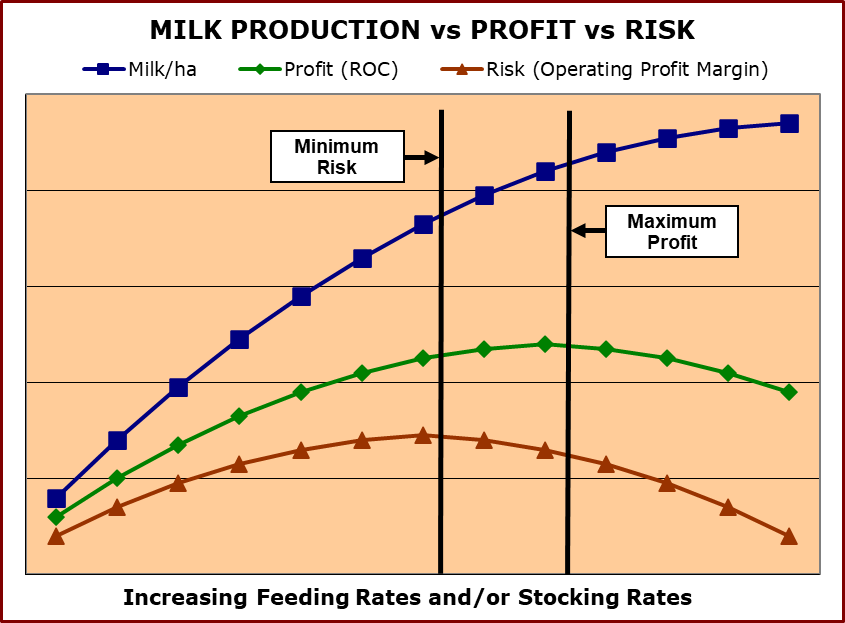
* Risk = Operating Profit Margin, therefore Higher figure = Lower risk
MILK PRODUCTION PER HECTARE – 15%-30% ABOVE AVERAGE
This increase in milk production per hectare comes from a combination of an increase in cows per hectare (‘stocking rate’) as well as an increase in milk produced per cow. The higher pasture harvest provides the opportunity to run more cows and/or have these cows produce more milk per cow.
Although it is difficult to draw firm conclusions about the role of stocking rate versus milk produced per cow in the most profitable pasture based farming systems, stocking rate may play the more significant role with increases of 10%-20% on average. Milk produced per cow usually increases 5%-15% on average, although the clear conclusion is that both are likely to have a role.
We can also conclude that the most profitable farms have moderate to high stocking rates and moderate to high levels of milk produced per cow. Low stocking rate or low levels of milk produced per cow are not characteristics of highly profitable farms, with the combination of both low stocking rate and low production per cow resulting in both low profit and high risk.
As described by Graph 1, high stocking rate and high levels of milk produced per cow are not required for highly profitable farms and this combination will almost certainly lead to a high degree of risk. It is an essential aspect of understanding highly profitable pasture based dairying to appreciate that “bigger” or “more” is not best when discussing milk production per hectare, milk production per cow or stocking rate. Unlike most other relationships, in this case there is a position where a moderate to high (but not very high) level of performance is “best”. This is akin to choosing a position of “sitting on the fence” although the fence is farm specific depending on a combination of milk price, potential pasture growth, supplementary feed price and base cost structure.
SUPPLEMENTARY FEED PRICE – 5%-20% BELOW AVERAGE
This reduction in supplementary feed price is likely to be in regards to both forages and concentrates. The forage costs often have more elasticity than the concentrate costs, and highly profitable farms are likely to be purchasing forages 5%-25% below average.
The two major areas where they reduce their costs are through producing the forages on either the dairy area or other support area under their control, and by increasing the yield of forage crops where this directly impacts on their costs. The cost of this feed (‘home grown’) can be substantially less than for most purchased feeds, even when a cost of land ownership or lease cost is included.
In the case of concentrates there is often less opportunity to produce these as home grown feeds. As with forages there is usually some opportunity to reduce costs by astute purchasing decisions. Although this could account for the 5%-15% advantage highly profitable farms generally have with their purchasing of concentrates, there are likely to be other factors.
These other factors include targeting appropriately composed concentrates in relation to the level of milk production being targeted. In the area of both choice of grain(s) and level of protein there is likely to be little over-specification in the ration. In addition, both the level and cost of minerals, trace elements and additives are likely to be closely monitored and not over-specified.
LABOUR EFFICIENCY – 10%-30% ABOVE AVERAGE
The increase in labour efficiency when expressed as cows milked per full time staff equivalent is in the order of 10-30 cows per person for highly profitable farms. There are also examples where this increase in efficiency can be as high as 40-70 cows. These improvements are not dependent on farm systems as there is evidence of high labour efficiency under all systems.
Although in some instances the differences from average could be explained by the amount of contracted work being employed by individual farms (e.g. for forage harvesting, fertiliser applications, etc) as opposed to being completed by farm staff, this does not account for the very significant variations outlined.
These highly profitable farms with high staff efficiency may well have some additional capital employed to gain these improvements. This could include examples such as cup removers in the dairy, or feeding systems where the dairy, feedpad and feed storage/bunkers are all centrally located.
Most noteworthy about these farmers is that their organisation is first rate. They have become skilled people managers and ensured they have excellent management systems in place. And they have learnt the skills to manage their business rather than simply work in the business.
BASE COST STRUCTURE – 5%-15% BELOW AVERAGE
The lower base cost structure that characterises highly profitable farms confirms the attitude or focus of these business operators. Cost control is an essential component of every good business. Given the high proportion of variable costs in pasture based dairying there is an even higher requirement to maintain a low base cost structure.
Given the relative complexity of pasture based dairying businesses it is not necessarily a surprise that many operators do not keep a tight rein on costs. For many operators there is significantly more enjoyment gained from endeavouring to increase the amount of milk produced per cow than there is from maintaining a low cost structure.
The result is that it is rare to see a “mixed” result when scrutinising a farmers base costs. They are normally consistently low, average or high. Wherever there is the combination of relatively high output (i.e. milk and pasture) and a low general cost structure, the result by very definition is likely to be a highly productive farm.
High productivity should be the goal of most dairy businesses if they wish to be highly profitable. The critical difference between a high production farm (which may have a low level of profitability) and a high productivity farm is that the high productivity farm has addressed its cost structure as well as its revenue base. As a result it should also be highly profitable and have a secure future.
APPENDIX I
The Summary Performance report and Per Cow Performance report has been produced using Red Sky Farm Performance Analysis and outline the performance of dairy farms in New Zealand plus a number of states/districts in Australia. These areas include South Western Victoria and Gippsland (predominantly non-irrigated dairying), Northern Victoria (predominantly irrigated), and Tasmania (approximately 30% of land area irrigated).
The Australian data comes entirely from farms that have had their full data entered into Red Sky, with the exception of teh Western Australia data which was initially recorded by Department of Agriculture using their DFP software and then the results converted into Red Sky. The majority of the Tasmanian data was provided courtesy of Department of Primary Industry, Water & Environment as this had initially been received as part of their annual dairy farmer competition.
The column of New Zealand data marked ‘RS’ comes entirely from farms that have had their full data entered into Red Sky.
Although all data is marked as ‘Average’ or ‘Top 10%’, the data could reasonably be considered as coming from the top 50%-70% of farms and hence the Top 10% coming from the top 5%-7% of farms. The Tasmanian data may be the most selective in that it may reasonably be expected to have come from the higher performing farms.
Sample numbers are relatively small, although most of the data has been entered by rural professionals and a majority has full physical as well as financial data available. The New Zealand Red Sky data has 243 farms in the benchmark and the Australian Red Sky benchmarks a total of 193 farms. To generate the split in district performance for Victoria there was a need to include two years data on a weighted basis and assume some core costs would be similar across the districts.
As a result of these issues and overall sample size, care should be taken when interpreting this data. No claim is made that this data is fully representative of the dairying districts/countries identified.